KQL Series – how not to waste $ running ADX clusters

This blog post is based on my personal experience running an Azure Data Explorer (ADX) cluster.

I was doing a presentation for Data Platform Summit in India, I spun up my cluster, created database/tables, ingested data and forgot to tear down the cluster.

I also scaled it right up to show how we can make things go faster…

…when we scale things in Azure – it costs more!!

I burned through my monthly MSDN subscription allowance in 2 days…

So here are a couple of ways you can not waste money with cloud resources.

  1. Learn Infrastructure as Code…
    I use terraform on an hourly basis and so my first go to is spin it up, ingest data, use it then tear it down.
    When I need the cluster again – just run my script:
resource "azurerm_resource_group" "rg" {
  name     = "my-kusto-rg"
  location = "Australia East"
}

resource "azurerm_kusto_cluster" "cluster" {
  name                = "kustocluster"
  location            = azurerm_resource_group.rg.location
  resource_group_name = azurerm_resource_group.rg.name

  sku {
    name     = "Standard_D13_v2"
    capacity = 2
  }
}

resource "azurerm_kusto_database" "database" {
  name                = "my-kusto-database"
  resource_group_name = azurerm_resource_group.rg.name
  location            = azurerm_resource_group.rg.location
  cluster_name        = azurerm_kusto_cluster.cluster.name

  hot_cache_period   = "P7D"
  soft_delete_period = "P31D"
}
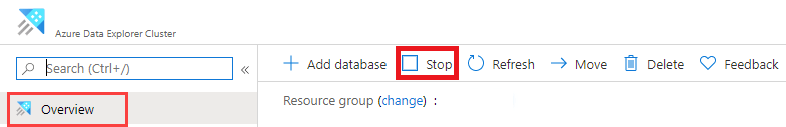
  1. Stop your cluster when not in use:
    To stop the cluster, at the top of the Overview tab, select Stop.
  1. To restart the cluster, at the top of the Overview tab, select Start.
    When the cluster is restarted, it takes about 10 minutes for it to become available (like when it was originally provisioned).
    It takes more time for data to load into the hot cache.

Unless you absolutely do need to have the cluster around my recommendation is to use Infrastructure as Code to spin it up as you need it then destroy it. Because as much as I love Azure – I also love saving my own and client money…

#Yip.

Advertisement

KQL Series – create a database in our ADX cluster

In the previous blog post we created an Azure Data Explorer (ADX) cluster.

In this blog post we will create a database that we will ingest data into, as part of this process:

  1. On the Overview tab, select Create database.
  2. Fill out the form with the following information.
SettingSuggested valueField description
AdminDefault selectedThe admin field is disabled. New admins can be added after database creation.
Database nameTestDatabaseThe name of database to create. The name must be unique within the cluster.
Retention period365The number of days that data is guaranteed to be kept available for querying. The period is measured from the time data is ingested.
Cache period31The number of days to keep frequently queried data available in SSD storage or RAM to optimize querying
  1. Select Create to create the database. Creation typically takes less than a minute. When the process is complete, you’re back on the cluster Overview tab.
  2. Now that we’ve created the cluster and database, we can run some basic queries and commands. The database doesn’t have data yet, but we can see how the tools work.
  3. Under our cluster, select Query. Paste the command .show databases into the query window, then select Run.
    The result set shows TestDatabase, the only database in the cluster.
  4. Paste the command .show tables into the query window and select Run.
    This command returns an empty result set because we don’t have any tables yet. We will add a table and ingest data in one of the next blog posts.

KQL Series – create an Azure Data Explorer cluster

I have written a lot about the magic of KQL and the brilliance of Azure Data Explorer.

Now we should create a cluster of our own that hosts Azure Data Explorer…
To use Azure Data Explorer, we first create a cluster, and create one or more databases in that cluster. Then we’ll ingest data into that database so that we can run queries against it.

If you don’t have an Azure subscription, create a free Azure account before you begin.

Here is how we will create an Azure Data Explorer cluster:

Steps:

  1. Login into the Azure portal
  2. Create an Azure Data Explorer cluster with a defined set of compute and storage resources in an Azure resource group.Select the + Create a resource button in the upper-left corner of the portal.
  3. Search for Azure Data Explorer.
  4. Under Azure Data Explorer, select Create.
  5. Fill out the basic cluster details with the following information.
SettingSuggested valueField description
SubscriptionYour subscriptionSelect the Azure subscription that you want to use for your cluster.
Resource groupYour resource groupUse an existing resource group or create a new resource group.
Cluster nameA unique cluster nameChoose a unique name that identifies your cluster. The domain name [region].kusto.windows.net is appended to the cluster name you provide. The name can contain only lowercase letters and numbers. It must contain from 4 to 22 characters.
RegionWest US or West US 2Select West US or West US 2 (if using availability zones) for this quickstart. For a production system, select the region that best meets your needs.
WorkloadDev/TestSelect Dev/Test for this quickstart. For a production system, select the specification that best meets your needs.
Compute specificationsDev(No SLA)_Standard_E2a_v4Select Dev(No SLA)_Standard_E2a_v4 for this quickstart. For a production system, select the specification that best meets your needs.
Availability zones12, or 3Place the cluster instances in one or more availability zones in the same region (optional). Azure Availability Zones are unique physical locations within the same Azure region. They protect an Azure Data Explorer cluster from loss data. The cluster nodes are created, by default, in the same data center. When you select several availability zones you can eliminate a single point of failure and ensure high availability. Deployment to availability zones is possible only when creating the cluster, and can’t be modified later.
  1. Select Review + create to review your cluster details, and on the next screen select Create to provision the cluster. Provisioning typically takes about 10 minutes.
  2. When the deployment is complete, select Go to resource.

KQL Series – Interactive Analytics with Azure Data Explorer

This blog is about how we can do interactive analytics with Azure Data Explorer to explore data with ad hoc, interactive, and lightning fast queries over small to extremely large volumes of data. This data exploration can be done using native Azure Data Explorer tools or alternative tools of your choice.

This is one of my favourite use cases of Azure Data Explorer as it shows the integration of it with the rest of the data platform ecosystem. You know being someone who loves all things Azure and being a Data Platform MVP means this is totally in my wheelhouse…. 😊

Architecture

Dataflow

  1. Raw structured, semi-structured, and unstructured (free text) data such as, any type of logs, business events, and user activities can be ingested into Azure Data Explorer from various sources. Ingest the data in streaming or batch mode using various methods.
  2. Ingest data into Azure Data Explorer with low-latency and high-throughput using its connectors for Azure Data FactoryAzure Event HubAzure IoT HubKafka, and so on. Instead, ingest data through Azure Storage (Blob or ADLS Gen2), which uses Azure Event Grid and triggers the ingestion pipeline to Azure Data Explorer. You can also continuously export data to Azure Storage in compressed, partitioned parquet format and seamlessly query that data as detailed in continuous data export overview.
  3. Run interactive queries over small to extremely large volumes of data using native Azure Data Explorer tools or alternative tools of your choice. Azure Data Explorer provides many plugins and integrations with the rest of the data platform ecosystem. Use any of the following tools and integrations:
  4. Enrich data running federated queries by combining data from SQL database and Azure Cosmos DB using Azure Data Explorer plugins.

Components

  • Azure Event Hub: Fully managed, real-time data ingestion service that’s simple, trusted, and scalable.
  • Azure IoT Hub: Managed service to enable bi-directional communication between IoT devices and Azure.
  • Kafka on HDInsight: Easy, cost-effective, enterprise-grade service for open-source analytics with Apache Kafka.
  • Azure Data Factory: Hybrid data integration service that simplifies ETL at scale.
  • Azure Data Explorer: Fast, fully managed and highly scalable data analytics service for real-time analysis on large volumes of data streaming from applications, websites, IoT devices, and more.
  • Azure Data Explorer Dashboards: Natively export Kusto queries that were explored in the Web UI to optimized dashboards.
  • Azure Cosmos DB: Fully managed fast NoSQL database service for modern app development with open APIs for any scale.
  • Azure SQL DB: Build apps that scale with the pace of your business with managed and intelligent SQL in the cloud.

I really would love to convince one of my clients to try something like this.

You can read a Microsoft client story here:
https://customers.microsoft.com/en-us/story/817285-episerver-professional-services-azure-sweden

It was really exciting reading what they are doing with Azure Data Explorer and of course KQL!!

#Yip.

KQL Series – Security Monitoring with Azure Data Explorer

This blog post demonstrates a hybrid end-to-end monitoring solution integrated with Microsoft Sentinel and Azure Monitor for ingesting streamed and batched logs from diverse sources, on-premises, or any cloud, within an enterprise ecosystem.

Architecture

Workflow

  1. Combine features provided by Microsoft Sentinel and Azure Monitor with Azure Data Explorer to build a flexible and cost-optimized end-to-end monitoring solution. Below are some examples:
    1. Use Microsoft Sentinel as a SIEM and SOAR component in the overall monitoring solution where you can ingest security logs from firewalls, Defender for Cloud, and so on. SIEM is short for security information and event management, whereas SOAR is short for security orchestration, automation and response.
    1. Use Azure Monitor’s native capabilities for IT asset monitoring, dashboarding, and alerting so you can ingest logs from VMs, services, and so on.
    1. Use Azure Data Explorer for full flexibility and control in all aspects for all types of logs in the following scenarios:
      1. No out of the box features provided by Microsoft Sentinel and Azure Monitor SaaS solutions such as application trace logs.
      1. Greater flexibility for building quick and easy near-real-time analytics dashboards, granular role-based access control, time series analysis, pattern recognition, anomaly detection and forecasting, and machine learning. Azure Data Explorer is also well integrated with ML services such as Databricks and Azure Machine Learning. This integration allows you to build models using other tools and services and export ML models to Azure Data Explorer for scoring data.
      1. Longer data retention is required in cost effective manner.
      1. Centralized repository is required for different types of logs. Azure Data Explorer, as a unified big data analytics platform, allows you to build advanced analytics scenarios.
  2. Query across different products without moving data using the Azure Data Explorer proxy feature to analyze data from Microsoft Sentinel, Azure Monitor, and Azure Data Explorer in a single query.
  3. To ingest logs with low latency and high throughput from on-premises or any other cloud, use native Azure Data Explorer connectors such as LogstashAzure Event Hub, or Kafka.
  4. Alternatively, ingest data through Azure Storage (Blob or ADLS Gen2) using Apache NifiFluentd, or Fluentbit connectors. Then use Azure Event Grid to trigger the ingestion pipeline to Azure Data Explorer.
  5. You can also continuously export data to Azure Storage in compressed, partitioned parquet format and seamlessly query that data as detailed in the Continuous data export overview.

Components

  • Azure Event Hub: Fully managed, real-time data ingestion service that’s simple, trusted, and scalable.
  • Azure IoT Hub: Managed service to enable bi-directional communication between IoT devices and Azure.
  • Kafka on HDInsight: Easy, cost-effective, enterprise-grade service for open source analytics with Apache Kafka.
  • Azure Data Explorer: Fast, fully managed and highly scalable data analytics service for real-time analysis on large volumes of data streaming from applications, websites, IoT devices, and more.
  • Azure Data Explorer Dashboards: Natively export Kusto queries that were explored in the Web UI to optimized dashboards.
  • Microsoft Sentinel: Intelligent security analytics for your entire enterprise.
  • Azure Monitor: Full observability into your applications, infrastructure, and network

The best part about all this is Microsoft Sentinel is built on Azure Monitor (Log Analytics) which in turn, is built on Azure Data Explorer.

That means that switching between these services is seamless. Which allows us to reuse Kusto query language queries and dashboards across these services.

Do you see now why I really love KQL and ADX??

#Yip.

KQL Series – Big Data Analytics with Azure Data Explorer

This blog pos illustrates how Azure Data Explorer and Azure Synapse Analytics complement each other for near real-time analytics and modern data warehousing use cases.

This solution is already being used by Microsoft customers. For example, the Singapore-based ride-hailing company, Grab, implemented real-time analytics over a huge amount of data collected from their taxi and food delivery services as well as merchant partner apps. The team from Grab presented their solution at MS Ignite in this video (20:30 onwards). Using this pattern, Grab processed more than a trillion events per day.

This solution is optimized for the retail industry.

Dataflow

  1. Raw structured, semi-structured, and unstructured (free text) data such as any type of logs, business events, and user activities can be ingested into Azure Data Explorer from various sources.
  2. Ingest data into Azure Data Explorer with low-latency and high throughput using its connectors for Azure Data FactoryAzure Event HubAzure IoT HubKafka, and so on. Alternatively, ingest data through Azure Storage (Blob or ADLS Gen2), which uses Azure Event Grid and triggers the ingestion pipeline to Azure Data Explorer. You can also continuously export data to Azure Storage in compressed, partitioned parquet format and seamlessly query that data as detailed in the Continuous data export overview.
  3. Export pre-aggregated data from Azure Data Explorer to Azure Storage, and then ingest the data into Synapse Analytics to build data models and reports.
  4. Use Azure Data Explorer’s native capabilities to process, aggregate, and analyze data. To get insights at a lightning speed, build near real-time analytics dashboards using Azure Data Explorer dashboardsPower BIGrafana, or other tools. Use Azure Synapse Analytics to build a modern data warehouse and combine it with the Azure Data Explorer data to generate BI reports on curated and aggregated data models.
  5. Azure Data Explorer provides native advanced analytics capabilities for time series analysis, pattern recognition, anomaly detection and forecasting, and machine learning. Azure Data Explorer is also well integrated with ML services such as Databricks and Azure Machine Learning. This integration allows you to build models using other tools and services and export ML models to Azure Data Explorer for scoring data.

Components

  • Azure Event Hub: Fully managed, real-time data ingestion service that’s simple, trusted, and scalable.
  • Azure IoT Hub: Managed service to enable bi-directional communication between IoT devices and Azure.
  • Kafka on HDInsight: Easy, cost-effective, enterprise-grade service for open source analytics with Apache Kafka.
  • Azure Data Explorer: Fast, fully managed and highly scalable data analytics service for real-time analysis on large volumes of data streaming from applications, websites, IoT devices, and more.
  • Azure Data Explorer Dashboards: Natively export Kusto queries that were explored in the Web UI to optimized dashboards.
  • Azure Synapse Analytics: Analytics service that brings together enterprise data warehousing and Big Data analytics.

If you are looking to do anything with Big Data I highly recommend you look at Azure Data Explorer or ADX

#Yip.

KQL Series – quick intro to Azure Data Explorer

Azure Data Explorer is a PaaS offering from Azure providing an end-to-end solution for data exploration.

https://azure.microsoft.com/en-us/blog/individually-great-collectively-unmatched-announcing-updates-to-3-great-azure-data-services/

Here is a quick introduction of the features:

https://azure.microsoft.com/en-us/services/data-explorer/#features

This service from Azure was developed to provide end-to-end data exploration services to help the businesses get quick insights, and make critical business decisions. It can be used for streaming data as well to identify patterns, statistics, anomalies, outliers, and even to diagnose issues.

ADX is a fully managed data analytics service for near real-time analysis on large volumes of data streaming (i.e. log and telemetry data) from such sources as applications, websites, or IoT devices.  ADX makes it simple to ingest this data and enables you to perform complex ad-hoc queries on the data in seconds – ADX has speeds of up to 200MB/sec per node (up to 1,000 nodes) and queries across a billion records take less than a second (!!).  A typical use case is when you are generating terabytes of data from which you need to understand quickly what that data is telling you, as opposed to a traditional database that takes longer to get value out of the data because of the effort to collect the data and place it in the database before you can start to explore it. This allows us to iterate our queries really, really quickly.

Azure Data Explorer has a very fast indexing and a very powerful query language to work with the data. You guessed it – that language is Kusto Query Language!!.

Azure Data Explorer aka ADX, is a fast, highly scalable and fully managed data analytics service for log, telemetry and streaming data. This data exploration service enables you to pull together, store and analyze diverse data. You can query terabytes of data in a few seconds and it allows fast ad-hoc queries over the varied data.

ADX is a PaaS offering from Azure, which is capable of performing analysis on large volumes of data from heterogeneous sources, like – Custom Applications, IoT Devices, Diagnostic Logs, and other streaming data sources as well. This data can be structured, unstructured, or free text.

Data within ADX is organized in relational tables within the database, which has a strongly typed schema. It can scale quickly depending upon the ingested data volume and query load.

ADX works on the principle of isolation between Compute and Storage using volatile SSD storage as a cache and persistent storage in Azure Blob Storage. It is a fully managed ‘Platform as a Service (PaaS)’ that lets users focus only on their data and queries.

Azure Data Explorer can be used with other Azure offerings to create end-to-end solutions for various use cases.

Let’s have a look at some of those use cases for ADX.

#Yip.

KQL Series – KQL usage with Advanced Hunting (this is huge)

This blog post is about another use of KQL that will definitely help your organisation and make you very popular.
First of all check out this video here which can help you learn stuff about KQL:

https://www.microsoft.com/en-us/videoplayer/embed/RWRwfJ?postJsllMsg=true

I have been talking about KQL and using it with Log Analytics and also Application Insights.

We use Log analytics for all our infrastructure things and combine with Azure Monitor to “do” things with our captured data:

But just as equally important is Advanced Hunting – where we can use KQL and start looking at what security events are occurring within our Azure Subscription.

https://security.microsoft.com/v2/advanced-hunting

(NOTE: you do need an Azure subscription to run this)

Advanced hunting is based on the Kusto query language. We can use Kusto operators and statements to construct queries that locate information in a specialized schema.

Here is an example that we can run:

// Finds PowerShell execution events that could involve a download union DeviceProcessEvents, DeviceNetworkEvents
| where Timestamp > ago(7d)
// Pivoting on PowerShell processes
| where FileName in~ ("powershell.exe", "powershell_ise.exe")
// Suspicious commands
| where ProcessCommandLine has_any
("WebClient",
"DownloadFile",
"DownloadData",
"DownloadString",
"WebRequest",
"Shellcode",
"http",
"https")
| project Timestamp, DeviceName, InitiatingProcessFileName, InitiatingProcessCommandLine, FileName, ProcessCommandLine, RemoteIP, RemoteUrl, RemotePort, RemoteIPType
| top 100 by Timestamp

A short comment has been added to the beginning of the query to describe what it is for. This comment helps if you later decide to save the query and share it with others in your organization.

// Finds PowerShell execution events that could involve a download

The query itself will typically start with a table name followed by several elements that start with a pipe (|). In this example, we start by creating a union of two tables, DeviceProcessEvents and DeviceNetworkEvents, and add piped elements as needed.

union DeviceProcessEvents, DeviceNetworkEvents

Set the time range

The first piped element is a time filter scoped to the previous seven days. Limiting the time range helps ensure that queries perform well, return manageable results, and don’t time out.

| where Timestamp > ago(7d)

Check specific processes

The time range is immediately followed by a search for process file names representing the PowerShell application.

// Pivoting on PowerShell processes
| where FileName in~ ("powershell.exe", "powershell_ise.exe")

Search for specific command strings

Afterwards, the query looks for strings in command lines that are typically used to download files using PowerShell.

// Suspicious commands
| where ProcessCommandLine has_any("WebClient",
    "DownloadFile",
    "DownloadData",
    "DownloadString",
    "WebRequest",
    "Shellcode",
    "http",
    "https")

Customize result columns and length

Now that your query clearly identifies the data you want to locate, you can define what the results look like. project returns specific columns, and top limits the number of results. These operators help ensure the results are well-formatted and reasonably large and easy to process.

| project Timestamp, DeviceName, InitiatingProcessFileName, InitiatingProcessCommandLine, 
FileName, ProcessCommandLine, RemoteIP, RemoteUrl, RemotePort, RemoteIPType
| top 100 by Timestamp

Select Run query to see the results.

This truly an amazing usage of KQL in my opinion!!

You can read more about Advanced hunting  (Formerly known as Advanced Threat Protection) here:

https://docs.microsoft.com/en-us/microsoft-365/security/defender/advanced-hunting-query-language?view=o365-worldwide

KQL Series – SQL to KQL Cheat Sheet

This blog post is about how to quickly learn KQL.

Kusto supports a subset of the SQL language. See the list of SQL known issues for the full list of unsupported features.

The primary language to interact with the Kusto Engine is KQL (Kusto Query Language). To make the transition and learning experience easier, you can use Kusto to translate SQL queries to KQL. Send an SQL query to Kusto, prefixing it with the verb ‘EXPLAIN’.

So let’s write some SQL here:

EXPLAIN
SELECT COUNT_BIG(*) as C FROM StormEvents

and we get:

StormEvents
| summarize C=count()
| project C

Reproduced from here:

https://docs.microsoft.com/en-us/azure/data-explorer/kusto/query/sqlcheatsheet#sql-to-kusto-cheat-sheet-1

SQL to Kusto cheat sheet

The table below shows sample queries in SQL and their KQL equivalents.

CategorySQL QueryKusto Query
Select data from tableSELECT * FROM dependenciesdependencies
SELECT name, resultCode FROM dependenciesdependencies | project name, resultCode
SELECT TOP 100 * FROM dependenciesdependencies | take 100
Null evaluationSELECT * FROM dependencies
WHERE resultCode IS NOT NULL
dependencies
| where isnotnull(resultCode)
Comparison operators (date)SELECT * FROM dependencies
WHERE timestamp > getdate()-1
dependencies
| where timestamp > ago(1d)
SELECT * FROM dependencies
WHERE timestamp BETWEEN ... AND ...
dependencies
| where timestamp > datetime(2016-10-01)
  and timestamp <= datetime(2016-11-01)
Comparison operators (string)SELECT * FROM dependencies
WHERE type = "Azure blob"
dependencies
| where type == "Azure blob"
-- substring
SELECT * FROM dependencies
WHERE type like "%blob%"
// substring
dependencies
| where type contains "blob"
-- wildcard
SELECT * FROM dependencies
WHERE type like "Azure%"
// wildcard
dependencies
| where type startswith "Azure"
// or
dependencies
| where type matches regex "^Azure.*"
Comparison (boolean)SELECT * FROM dependencies
WHERE !(success)
dependencies
| where success == "False"
Grouping, AggregationSELECT name, AVG(duration) FROM dependencies
GROUP BY name
dependencies
| summarize avg(duration) by name
DistinctSELECT DISTINCT name, type FROM dependenciesdependencies
| summarize by name, type
SELECT name, COUNT(DISTINCT type)
FROM dependencies
GROUP BY name
dependencies
| summarize by name, type | summarize count() by name
// or approximate for large sets
dependencies
| summarize dcount(type) by name
Column aliases, ExtendingSELECT operationName as Name, AVG(duration) as AvgD FROM dependencies
GROUP BY name
dependencies
| summarize AvgD = avg(duration) by Name=operationName
SELECT conference, CONCAT(sessionid, ' ' , session_title) AS session FROM ConferenceSessionsConferenceSessions
| extend session=strcat(sessionid, " ", session_title)
| project conference, session
OrderingSELECT name, timestamp FROM dependencies
ORDER BY timestamp ASC
dependencies
| project name, timestamp
| order by timestamp asc nulls last
Top n by measureSELECT TOP 100 name, COUNT(*) as Count FROM dependencies
GROUP BY name
ORDER BY Count DESC
dependencies
| summarize Count = count() by name
| top 100 by Count desc
UnionSELECT * FROM dependencies
UNION
SELECT * FROM exceptions
union dependencies, exceptions
SELECT * FROM dependencies
WHERE timestamp > ...
UNION
SELECT * FROM exceptions
WHERE timestamp > ...
dependencies
| where timestamp > ago(1d)
| union
  (exceptions
  | where timestamp > ago(1d))
JoinSELECT * FROM dependencies
LEFT OUTER JOIN exception
ON dependencies.operation_Id = exceptions.operation_Id
dependencies
| join kind = leftouter
  (exceptions)
on $left.operation_Id == $right.operation_Id
Nested queriesSELECT * FROM dependencies
WHERE resultCode ==
(SELECT TOP 1 resultCode FROM dependencies
WHERE resultId = 7
ORDER BY timestamp DESC)
dependencies
| where resultCode == toscalar(
  dependencies
  | where resultId == 7
  | top 1 by timestamp desc
  | project resultCode)
HavingSELECT COUNT(*) FROM dependencies
GROUP BY name
HAVING COUNT(*) > 3
dependencies
| summarize Count = count() by name
| where Count > 3

The part I love the most is being able to use EXPLAIN to translate what I’ve written in for 20+ years into KQL.

Nice one Microsoft!!

#Yip.

KQL Series – creating KQL queries

Basically when we are writing KQL we are asking the following questions:

Does it exist?

Where does it exist?

Why does it exist?

What shall we do with the information?

We will come back to these as we go along – but we use these questions to construct our KQL query.

Here is a simple enough search query:

SecurityEvent
| where TimeGenerated > ago (3h)
| where EventID == 4782
| summarize count() by Account
| project Account, PasswordsCracked = count_

(Note you can run this query here: https://aka.ms/LADemo )

Steps to create this query:

  1. Identify the table we want to run our query against. So here we are running against the Security Event table. The SecurityEvent table contains security events collected from windows machines by Microsoft Defender for Cloud or Microsoft Sentinel.
  2. We make use of the pipe | character which is above the enter/return key (return if you are on a Mac) and we use shift to get it. It is sued to separate commands issued to the query engine. In the example above each command is on its own line.
    A KQL query can be all one single line. As a recommendation, I prefer each command on its own line. It is neater and more organized which makes it easier to troubleshoot when a query fails (as mine typically do from time to time!!)
  3. Just as we would with other SQL languages we want to filter things. If we just ran this – we would get all security events in the past 24 hours…

The Where operator is the best way to accomplish this. You can see here in the example that we’re filtering first by when the occurrence happened (TimeGenerated) and then by Windows Event ID (4782 – the password hash of an account was accessed.).

4. The next step in our workflow is to provide data aggregation. What do we want to do with this filtered data? In the example, we want to create a count of the Accounts (usernames) that produced event ID of 4782 in the time greater than 3 hours ago.

5. Lastly we want to present the data, we use Project for this. We tell the engine we only want to display 2 columns in our results Account and PasswordsCracked.

You’ll see that we go zero results – so let’s change our query and look for logoff events – EventID of 4634

SecurityEvent
| where TimeGenerated > ago (3h)
| where EventID == 4634
| summarize count() by Account
| project Account, LogOffEvents = count_

What do we get now?

Being a data professional we should order our data so we will tell the query engine how we want to order the results.
SecurityEvent
| where TimeGenerated > ago (3h)
| where EventID == 4634
| summarize count() by Account
| order by count_ desc
| project Account, LogOffEvents = count_


Using the Order operator above, we’re telling the query engine that when the results are displayed, I want it shown in order by the LogOffEvents column.


The ‘desc’ in the query in the Order Data step is what produces this ordering. If we wanted ascending order we’d use ‘asc’.

So what did we do here?

It searched our stored security events in the SecurityEvent table for all Accounts that had a successful login in the last 3 hours and we chose to display only the Account and number of log off events per Account in numerical order with the highest at the top.

So far I’ve introduced some new operators and things – but what is a really quick way to learn KQL?

Let’s look at the best cheat sheet ever…

#Yip.